Tuesday, November 25, 2014

More Scala Web Development with Spring and JSTL


Continuing on from my previous blog post, where I describe the setup and some initial work to build a custom Business Intelligence (BI) tool around anonymized Medicare data, using Solr, Scala, Spring and JSTL. In this post, I will cover the remainder of the application, but unlike most of my other posts, I won't include any code. Instead, I will describe the tool from a (mostly) user-centric perspective, describing what you can do with it, and taking short detours to address the how. All the code for this project is available on GitHub, along with instructions on how to run the tool locally.

Population View


I left off last week with a single page application, the Population Demographics view. On this page, we report the distribution of members across attributes such as gender, age, ethnicity, state of residence and diseases (a member can have zero or more diseases). Each distribution is reported as a bar chart and a table in which the user is able to select one or more attribute values. Shown below is the report for the Age distribution.


Somewhat unsurprisingly, the majority of members appear to be aged between 70 and 90. Similarly, if you look at the other attributes, you will find that members are 45% Male and 55% Female, and that the majority are White (83%). California, Florida, Texas and New York have the most members (9%, 7%, 5.8% and 5.7% respectively). The most frequently observed disease is Ischemic Heart Disease (IHD) at 19%, followed by Diabetes at 17% and Congestive Heart Failure (CHF) at 13%. Interesting information perhaps (at least to lay people like me), but probably not news for people who work in population health.

But what if you are interested in the disease profile for 30-50 year old men from California compared to the national average? From the screenshots below, the younger cohort from CA (left) appears to be proportionally more prone to Depression and less prone to Cancer.


Or imagine you wanted to know how the ethnic distribution of members from California has changed in recent years. The screenshot on the right shows the ethnic distribution of members 30-40 years old and the one on the left shows the distribution for ages 40 and up. As you can see, California has become more diverse in recent years, at least in terms of Medicare members.


The functionality described above were implemented with Solr's Faceted Search. In all but Age, the attributes (Gender, Ethnicity, State and Disease) were the facet fields. In case of Age, we sent two initial Sort queries to find the minimum and maximum dates of birth, then partitioned the range into 10 bins, building the facets using date range queries. All the Solr code can be found in SolrService.scala.

Mortality View


Once you have selected a subpopulation in this manner, you can look at various other things. For a somewhat morbid example, you can look at the distribution of mortality rates for various diseases. Here is the distribution of ages of death for members who had some form of heart disease.


A subset of member records had a date of death populated. I found this after populating the index (populating the index took a little over a day for me), so I used Solr's partial update feature (see MortalityUpdater.scala) to compute a new age_at_death field from the birth and death dates and update this field into the index. From that point on it was two queries to get the max and min ages, partitioning the range and building a set of range facet queries on this field.

Codes View


Another way to look at a selected subpopulation is as a distribution of medical codes. Three types of codes are mentioned in the claims - the ICD-9 diagnostic codes, the ICD-9 procedure codes and the HCPCS codes. Below we show the top ICD-9 diagnostic codes for 30-60 year old Male Californians with heart disease (IHD, CHF and Stroke/TIA).


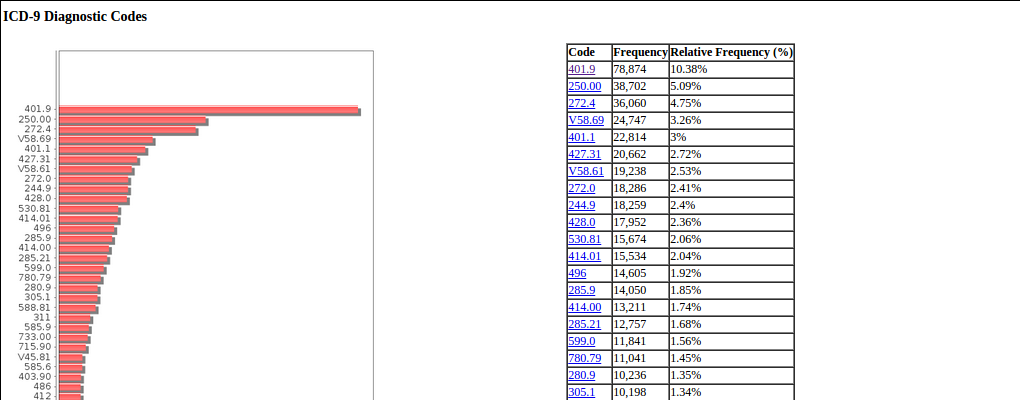
The top ICD-9 code 401.9 means Unspecified Essential Hypertension, aka High Blood Pressure, which seems to be a reasonable diagnosis for heart disease patients. It occurs 10% of the time across both types of claim - Inpatient and Outpatient. You can click on the codes to go to code lookup pages hosted by cms.gov, but if you are a company doing this for real, you would probably want to buy the code list and have the description show up beside the code without this extra step. The above results can also be filtered to show only Inpatient claims or Outpatient claims. You can also do similar analysis for the other two codes as well.

The chart and associated reports for the three codes were done using a single Solr FacetQuery with facet fields set to the three multivalued code fields, filtering by the population selection criteria.

Costs View


Similar to the Codes view, where we analyze the distribution of codes, in the costs view, we analyze the distribution of costs across claims. I decided to use the claim payment amount as the "cost" parameter. Here is the cost distribution for the same cohort as before.


As you can see, most of the claim payments are under $1,000 and a small number of much higher values. The mean is $1,090 and standard deviation is $3,750. For a more interesting look, we can drill down to the range $0-$1,000.


This shows peaks at specific amounts - I suspect that these may be standard negotiated rates, but I could be wrong. For the implementation details, once again we compute the minimum and maximum claim payment amount for the selected cohort, then split up the range into 50 buckets, then execute the corresponding 50 facet queries (its a single request) using Solr's Facet Query functionality. The descriptive statistics box with Min, Max, Mean, StdDev, etc are from Solr's StatComponent.

Correlations View


Often it is instructive to see how a pair of parameters vary with each other. Correlations are often modeled with scatter plots, here we do this using a bubble chart with actual values for categorical variables like gender, ethnicity, state and comorbidity, and ranges for continuous variables like age. Here is a plot of the incidence of specific diseases over various age ranges, across the entire dataset.


Predictably, the incidence of various diseases seems to be highest in the 70-90 age range, although some of this is also the effect of higher number of members in this age group. Other correlations charts can be built as shown in the form above the chart above. Also you can also run each on population subsets, as shown below for our cohort of 30-60 year old male Californians with heart disease.


These bubble charts are backed by Solr Pivot Queries, a form of facet query where one can specify multiple dimensions of hierarchical facets (our example does two dimensions). This is true for all the facets except the ones that involve age. Since age is computed, it cannot reside in the index and therefore cannot participate in a facet query, so we simulate this by running multiple simple facet queries based on query facets and combining the results in code.

Patients View


The Patients View shows the actual member information for members in the selected cohort (based on what we have, since the data is anonymized). We order the patients by descending order of number of transactions, since the "interesting" patients from a data analyst's point of view are the ones with more transactions. For this, I added a new field num_io to each member record that counts the number of associated Inpatient and Outpatient claims, and sorted on that field. I could probably have used Solr's Join functionality but I had already denormalized the claim records to include the member data, and that was working better for me for the cohort filtering, so I decided not to. Here is the list of members for our 30-60 year old male Californians with heart disease cohort.


You could then select a particular patient and view the claim timeline, as shown in the example below. The chart across the top represents the claim amounts as a function of time (days since start on X-axis). The highlighted rows represent Inpatient claims and the others represent Outpatient claims.


Implementation wise, I used Solr's Solr's Deep paging feature to efficiently traverse the claim records from start to end (see IOCountUpdater.scala) and the partial update feature to update the num_io field. The search part is just simple filtering and sorting, we are not even using Lucene's query functionality here. In the first case (patient list), we are sorting by num_io and in the second case (patient timeline) we are sorting by claim date.

Charts


The charts in the application are built using the JFreeChart API. The ChartService.scala provides the services to draw 3 different types of charts - barchart, line and bubble. They are called from the chart() method in the ClaimController.scala, and the actual calls to it are made from JSPs via HTML img tags.

Nothing too fancy here, of course. The only reason I bring it up is that the data to plot is passed to the chart.html call as a URL-Encoded JSON Map object. Since the data is dynamically generated from a query, it can often be quite long and exceed the default length limit for HTTP GET URLs (8k chars for Tomcat and Jetty). To get around this, the container configuration needs to be tweaked to increase this limit (somewhat arbitarily to 64k chars). This is already done for the built-in Jetty container (via the custom jetty.xml, but if you want to do this on a standalone container, here are instructions for Jetty and Tomcat.

In retrospect, I should have used a List[(String,Double)] instead of a Map[String,Double], since the latter choice needs an additional sorting step inside the ChartService, but by the time it started hurting, I had already built a few charts, so I decided to just go with it and deal with it later.

Conclusion


Thats all I have today, hope you found it interesting. While the components that make up the tool are fairly commonplace, the tool can be used to slice and dice the data in interesting ways to derive intelligence out of this data and to find subpopulations of interest. In addition, (for me) it helped me play with some of the newer features of Solr 4.x with non-text data. In any case, its almost Thanksgiving, so for those of you in the US and Canada, Happy Thanksgiving, and for those of you not in the US or Canada, here's the link to Wikipedia :-).

Sunday, November 09, 2014

Scala Web Development with Spring and JSTL


Some time back, a colleague pointed me to some anonymized Medicare Claims data. It contains (structured) claims data from 2,326,856 members, consisting of 1,332,822 inpatient records and 15,826,987 outpatient records. It occurred to me that looking at selected subsets of this data across different dimensions may provide some interesting insights, perhaps using some kind of web-based tool that allows filtering over these dimensions. I even ingested this data into a Solr 4.9 index on my laptop that took quite a while to complete. However, I was distracted by something brighter/shinier, so the index just sat there until I got back to it last week.

People seem to prefer using ElasticSearch for analytics, but I already know Solr, so I decided to use Solr as the search backend. Since our main use case with Solr is concept searching (using our proprietary customizations) over text, I don't have much experience with the newer Solr 4.x features that focus on analytics style queries, so I figured this would be a good way to learn.

I decided to use Spring for the web framework, once again because I already know it and its the one web framework that feels kind of natural to me, and because some people (at Pivotal Labs) are doing it with Scala already. The last time I used a pure Scala stack (Play2) for this kind of work, I spent more time fighting with the framework than doing actual work, so especially for web applications, I prefer to use stuff I know.

One problem with this setup is that using JSTL comes with some challenges. Specifically, JSTL expects to see Java POJOs and Java collection objects, which are different from Scala case classes and collection objects. One possibility is to replace JSTL with Scalate Server Pages (SSP), but that creates its own set of problems, and ultimately I got round the problem by building a Data Transfer Layer (DTO) consisting of Java POJOs and populating these and sticking them into the model from my Scala code.

I plan on writing about this project over multiple posts, mainly because its going to take me multiple weeks to build, and also because one giant post at the end is too hard for me to write and (I think) too hard for you to read. In this post I concentrate on the basic setup and the first page which allows you to filter various population parameters. I am mainly interested in describing the data analysis part, but you could use the setup as a template to build your own data analysis (or other) project - it involves a Spring Controller that handles two kinds of requests, and delegates to Solr via a Service class, and a JSP that shows charts and information based on parameters passed in - in other words, somewhat more complex and realistic than the Pivotal Labs setup, although that did get me to where I am.

SBT Setup


I used giter8 to build the Scala project, then added the web plugin based on instructions from the Pivotal Labs blog post, so I could start and stop Jetty from sbt. Here is my build.sbt.

1
 2
 3
 4
 5
 6
 7
 8
 9
10
11
12
13
14
15
16
17
18
19
20
21
22
23
24
25
26
27
// Source: build.sbt

name := "claimintel"

organization := "com.mycompany"

version := "0.1"

scalaVersion := "2.10.2"

sbtVersion := "0.13.1"

jetty()

libraryDependencies ++= Seq(
  "org.apache.solr" % "solr-core" % "4.9.0",
  "org.springframework" % "spring-webmvc" % "4.0.0.RELEASE",
  "jfree" % "jfreechart" % "1.0.13",
  "org.eclipse.jetty" % "jetty-webapp" % "9.1.0.v20131115" % "container, compile",
  "org.eclipse.jetty" % "jetty-jsp" % "9.1.0.v20131115" % "container",
  "org.apache.commons" % "commons-lang3" % "3.0",
  "net.sourceforge.collections" % "collections-generic" % "4.01",
  "commons-beanutils" % "commons-beanutils" % "1.8.3",
  "commons-io" % "commons-io" % "2.4",
  "log4j" % "log4j" % "1.2.14",
  "com.novocode" % "junit-interface" % "0.8" % "test"
)

and my plugins.sbt:

1
2
3
4
5
// Source: project/plugins.sbt

addSbtPlugin("com.earldouglas" % "xsbt-web-plugin" % "1.0.0")

addSbtPlugin("com.typesafe.sbteclipse" % "sbteclipse-plugin" % "2.4.0")

This allows you to start and stop the Jetty container hosting the application from with the SBT shell, using the container:start and container:stop commands. For a real deployment, sbt package will build a WAR file. Once all the other components (described below) are in place, the application can be accessed from a browser at the URL "http://localhost:8080/index.html".

Web Setup


The web.xml file specifies that Spring will take care of routing URLs to the appropriate Controller class via the DispatcherServlet. We are using Spring's annotation based configuration to specify the routing information directly as annotations on the controller methods.

1
 2
 3
 4
 5
 6
 7
 8
 9
10
11
12
13
14
15
16
17
18
19
20
21
22
23
24
<!-- Source: src/main/webapp/WEB-INF/web.xml -->
<?xml version="1.0" encoding="UTF-8"?>
<web-app version="3.0" xmlns="http://java.sun.com/xml/ns/javaee" 
    xmlns:xsi="http://www.w3.org/2001/XMLSchema-instance" 
    xsi:schemaLocation="http://java.sun.com/xml/ns/javaee http://java.sun.com/xml/ns/javaee/web-app_3_0.xsd">
  <display-name>ClaimIntel Web Application</display-name>
  <servlet>
    <servlet-name>dispatcher</servlet-name>
    <servlet-class>org.springframework.web.servlet.DispatcherServlet</servlet-class>
    <load-on-startup>1</load-on-startup>
    <init-param>
      <param-name>contextClass</param-name>
      <param-value>org.springframework.web.context.support.AnnotationConfigWebApplicationContext</param-value>
    </init-param>
    <init-param>
      <param-name>contextConfigLocation</param-name>
      <param-value>com.mycompany.claimintel.Config</param-value>
    </init-param>
  </servlet>
  <servlet-mapping>
    <servlet-name>dispatcher</servlet-name>
    <url-pattern>*.html</url-pattern>
  </servlet-mapping>
</web-app>

The configuration to determine which JSP the controller sends its model to is specified in the Config.scala class below. This is part of the configuration for the DispatcherServlet.

1
 2
 3
 4
 5
 6
 7
 8
 9
10
11
12
13
14
15
16
17
18
19
20
// Source: src/main/scala/com/mycompany/claimintel/Config.scala
package com.mycompany.claimintel

import org.springframework.context.annotation.Bean
import org.springframework.context.annotation.ComponentScan
import org.springframework.web.servlet.view.InternalResourceViewResolver
import org.springframework.web.servlet.view.JstlView

@ComponentScan(basePackages = Array("com.mycompany.claimintel"))
class Config {

  @Bean
  def viewResolver = {
    val viewResolver = new InternalResourceViewResolver()
    viewResolver.setViewClass(classOf[JstlView])
    viewResolver.setPrefix("/WEB-INF/views/")
    viewResolver.setSuffix(".jsp")
    viewResolver
  }
}

Controller


The landing page of the application displays a set of bar charts down the left and corresponding numeric statistics down the right. Each bar chart shows the distribution of the member data along a specific dimension. For example, the first dimension is Gender. The bar chart shows the distribution by Gender (Male, Female). The corresponding table on the right lists the actual counts and percentages for Male and Female members, along with checkboxes that allow you to filter the results to only Male or Female members.

Similarly, the other dimensions displayed are Age (in 10 year bands), Ethnicity, State of Residence, and Comorbidity. All but the last dimension is mutually exclusive, ie, one member can have only one attribute at a time. However, for comorbidity, a member can have more than one disease at the same time. You can drill down into a dimension via one or more attributes by selecting and unselecting the associated checkbox. Selections are sticky so you can use this to look at sub-populations (for example, Diabetes in 40-60 year old Hispanic males across various states).

The landing page comes up via the index.html as well as population.html URLs. The charts are generated via img tags embedded in the index.jsp page, which call the chart.html URL. Notice that the annotations look similar to the corresponding Java ones with some minor differences.

1
  2
  3
  4
  5
  6
  7
  8
  9
 10
 11
 12
 13
 14
 15
 16
 17
 18
 19
 20
 21
 22
 23
 24
 25
 26
 27
 28
 29
 30
 31
 32
 33
 34
 35
 36
 37
 38
 39
 40
 41
 42
 43
 44
 45
 46
 47
 48
 49
 50
 51
 52
 53
 54
 55
 56
 57
 58
 59
 60
 61
 62
 63
 64
 65
 66
 67
 68
 69
 70
 71
 72
 73
 74
 75
 76
 77
 78
 79
 80
 81
 82
 83
 84
 85
 86
 87
 88
 89
 90
 91
 92
 93
 94
 95
 96
 97
 98
 99
100
101
102
103
104
105
106
107
108
109
110
111
112
113
114
115
116
117
118
119
120
121
122
123
// Source: src/main/scala/com/mycompany/claimintel/ClaimController.scala
package com.mycompany.claimintel

import java.net.URLEncoder

import javax.servlet.http.HttpServletRequest
import javax.servlet.http.HttpServletResponse

import scala.collection.JavaConversions._
import scala.util.parsing.json.JSON
import scala.util.parsing.json.JSONObject

import org.springframework.beans.factory.annotation.Autowired
import org.springframework.stereotype.Controller
import org.springframework.stereotype.Service
import org.springframework.ui.Model
import org.springframework.web.bind.ServletRequestUtils
import org.springframework.web.bind.annotation.RequestMapping
import org.springframework.web.bind.annotation.RequestMethod

import com.mycompany.claimintel.dtos.CategoryStats
import com.mycompany.claimintel.dtos.PopDistrib

@Controller
class ClaimController @Autowired() (
    solrService: SolrService, 
    chartService: ChartService){
  
  @RequestMapping(value = Array("/index.html"), 
      method = Array(RequestMethod.GET))
  def index(req: HttpServletRequest, res: HttpServletResponse, 
      model: Model): String = population(req, res, model)

  @RequestMapping(value = Array("/population.html"), 
      method = Array(RequestMethod.GET))
  def population(req: HttpServletRequest, res: HttpServletResponse, 
      model: Model): String = {
    val popFilters = buildPopulationFilter(req)
    val popFacets = solrService.populationFacets(popFilters)
    popFacets.keys.foreach(pfname => {
      val pfdata = popFacets(pfname)
      val popDistrib = new PopDistrib()
      popDistrib.setEncodedData(URLEncoder.encode(
        JSONObject(pfdata).toString(), "UTF-8"))
      val total = pfdata.values.foldLeft(0L)(_ + _)
      popDistrib.setStats(seqAsJavaList(pfdata.map(entry => {
          val cstats = new CategoryStats()
          cstats.setName(entry._1)
          cstats.setCount(entry._2)
          cstats.setPcount(1.0D * entry._2 / total)
          cstats.setSelected(solrService.isSelected(
            popFilters, pfname, entry._1))
          cstats
        })
        .toList
        .sortWith((a,b) => a.getName() < b.getName())))
      popDistrib.setTotal(total)
      model.addAttribute(pfname, popDistrib)
    })
    
    // the age facet is the only one that we will treat as
    // a continuous variable, so we distinguish by name
    val agedata = solrService.populationAgeFacet(popFilters)
    val ageDistrib = new PopDistrib()
    ageDistrib.setEncodedData(URLEncoder.encode(
      JSONObject(agedata).toString(), "UTF-8"))
    val ageTotal = agedata.values.foldLeft(0L)(_ + _)
    ageDistrib.setStats(seqAsJavaList(agedata.map(entry => {
      val cstats = new CategoryStats()
      cstats.setName(entry._1)
      cstats.setCount(entry._2)
      cstats.setPcount(1.0D * entry._2 / ageTotal)
      cstats.setSelected(solrService.isSelected(
        popFilters, "bene_age", entry._1))
      cstats
    })
    .toList
    .sortWith((a,b) => a.getName().split("-")(0).toInt < 
      b.getName().split("-")(0).toInt)))
    ageDistrib.setTotal(ageTotal)
    model.addAttribute("bene_age", ageDistrib)
    
    "index"
  }
  
  def buildPopulationFilter(req: HttpServletRequest): 
      List[(String,String)] = {
    val shouldFilter = ServletRequestUtils.getBooleanParameter(
      req, "filter", false)
    if (! shouldFilter) List.empty[(String,String)]
    else {
      val pmap = req.getParameterMap()
      req.getParameterNames()
        .filter(pname => (pname.startsWith("bene_") || 
            pname.startsWith("sp_")))
        .map(pname => pmap(pname).map(pval => (pname, pval)))
        .flatten
        .toList
    }
  }
  
  @RequestMapping(value = Array("/chart.html"),
      method = Array(RequestMethod.GET))
  def chart(req: HttpServletRequest, res: HttpServletResponse, 
      model: Model): String = {
    val chartType = ServletRequestUtils.getRequiredStringParameter(req, "type")
    val data = JSON.parseFull(
      ServletRequestUtils.getRequiredStringParameter(req, "data"))
      .get.asInstanceOf[Map[String,Double]]
    val title = ServletRequestUtils.getStringParameter(req, "title", "")
    val xtitle = ServletRequestUtils.getStringParameter(req, "xtitle", "")
    val ytitle = ServletRequestUtils.getStringParameter(req, "ytitle", "")
    val width = ServletRequestUtils.getIntParameter(req, "width", 500)
    val height = ServletRequestUtils.getIntParameter(req, "height", 300)
    chartType match {
      case "bar" => chartService.bar(
        data, title, xtitle, ytitle, true, width, height, 
        res.getOutputStream())
 
    }
    null
  }
}

Services


There are two services, one that interfaces with a Solr instance and provides application specific methods to retrieve data, and another that uses the JFreeChart API to render data driven charts. Both are auto-wired into the Controller using the @AutoWired() annotation.

The SolrService is shown below. The first method is fairly straightforward, and just sends a facet query using all dimensions except for age. Most of the rest of the code is to pull counts for age-band facets - we store member date of births in the index, but to the application, we expose a pseudo parameter "bene_age", so it also provides methods for the controller to convert back and forth between the range query on "bene_birth_date" and "bene_age".

1
  2
  3
  4
  5
  6
  7
  8
  9
 10
 11
 12
 13
 14
 15
 16
 17
 18
 19
 20
 21
 22
 23
 24
 25
 26
 27
 28
 29
 30
 31
 32
 33
 34
 35
 36
 37
 38
 39
 40
 41
 42
 43
 44
 45
 46
 47
 48
 49
 50
 51
 52
 53
 54
 55
 56
 57
 58
 59
 60
 61
 62
 63
 64
 65
 66
 67
 68
 69
 70
 71
 72
 73
 74
 75
 76
 77
 78
 79
 80
 81
 82
 83
 84
 85
 86
 87
 88
 89
 90
 91
 92
 93
 94
 95
 96
 97
 98
 99
100
101
102
103
104
105
106
107
108
109
110
111
112
113
114
115
116
117
// Source: src/main/scala/com/mycompany/claimintel/SolrService.scala
package com.mycompany.claimintel

import java.util.Calendar
import java.util.Date
import java.util.Locale
import java.util.regex.Pattern

import scala.collection.JavaConversions._

import org.apache.solr.client.solrj.SolrQuery
import org.apache.solr.client.solrj.SolrQuery.ORDER
import org.apache.solr.client.solrj.impl.HttpSolrServer
import org.springframework.stereotype.Service

@Service
class SolrService {
  
  val server = new HttpSolrServer("http://localhost:8983/solr/collection1")
  
  def name = "SolrService"
    
  def populationFacets(filters: List[(String,String)]): 
      Map[String,Map[String,Long]] = {
    val query = new SolrQuery()
    query.setQuery("*:*")
    query.setFilterQueries("rec_type:B")
    filters.filter(nv => (! "bene_age".equals(nv._1)))
      .foreach(nv => query.addFilterQuery(List(nv._1, nv._2)
                          .mkString(":")))
    query.setFacet(true)
    query.addFacetField("bene_sex", "bene_race", "sp_state", "bene_comorbs")
    query.setRows(0)
    val resp = server.query(query)
    resp.getFacetFields().map(ff =>
      (ff.getName(), ff.getValues()
        .map(fv => (fv.getName(), fv.getCount())).toMap))
      .toMap
  }

  def findDateOfBirth(youngest: Boolean): Date = {
    val query = new SolrQuery()
    query.setQuery("*:*")
    query.setFilterQueries("rec_type:B")
    query.setRows(1)
    query.setFields("bene_birth_date")
    query.setSortField("bene_birth_date", 
      if (youngest) ORDER.asc else ORDER.desc)
    val resp = server.query(query)
    resp.getResults()
      .head
      .getFieldValue("bene_birth_date")
      .asInstanceOf[Date]
  }
  
  def populationAgeFacet(filters: List[(String,String)]):
      Map[String,Long] = {
    // find top and bottom birth dates
    val youngestDob = findDateOfBirth(true)
    val oldestDob = findDateOfBirth(false)
    val now = new Date()
    val lb = round(yearsBetween(oldestDob, now), 10, false)
    val ub = round(yearsBetween(youngestDob, now), 10, true)
    val fqs = (lb to ub by 10)
      .sliding(2)
      .toList
      .map(v => intervalToQuery(v.mkString("-")))
    // now make the query
    val query = new SolrQuery()
    query.setQuery("*:*")
    query.setFilterQueries("rec_type:B")
    filters.filter(nv => ("bene_age".equals(nv._1)))
      .map(nv => intervalToQuery(nv._2))
      .foreach(fq => query.addFilterQuery(fq))
    query.setRows(0)
    query.setFacet(true)
    fqs.foreach(fq => query.addFacetQuery(fq))
    val resp = server.query(query)
    resp.getFacetQuery().entrySet()
      .map(e => (queryToInterval(e.getKey()), e.getValue().toLong))
      .toMap
  }

  def yearsBetween(d1: Date, d2: Date): Int = {
    val cal1 = Calendar.getInstance(Locale.getDefault())
    cal1.setTime(d1)
    val cal2 = Calendar.getInstance(Locale.getDefault())
    cal2.setTime(d2)
    cal2.get(Calendar.YEAR) - cal1.get(Calendar.YEAR)
  }
  
  def round(v: Int, nearest: Int, roundUp: Boolean): Int =
    if (roundUp) (Math.ceil(1.0D * v / nearest) * nearest).toInt
    else (Math.floor(1.0D * v / nearest) * nearest).toInt
    
  val IntervalQueryTemplate = 
    "bene_birth_date:[NOW-%dYEAR TO NOW-%dYEAR]"
  val IntervalQueryPattern = Pattern.compile(
    """bene_birth_date:\[NOW-(\d+)YEAR TO NOW-(\d+)YEAR\]""")
    
  def queryToInterval(q: String): String = {
    val m = IntervalQueryPattern.matcher(q)
    if (m.matches()) List(m.group(2), m.group(1)).mkString("-")
    else "0-0"
  }
  
  def intervalToQuery(interval: String): String = {
    val bounds = interval.split("-").map(_.toInt)
    IntervalQueryTemplate.format(bounds(1), bounds(0))
  }

  def isSelected(facetFilters: List[(String,String)], 
      klhs: String, krhs: String): Boolean = 
    facetFilters.filter(nvp => 
      (klhs.equals(nvp._1) && krhs.equals(nvp._2)))
      .size > 0
}

The ChartService currently only has a single method to render bar charts. As you can see, the code is very boilerplate-y, but the idea is to provide high level methods that allow the caller to plot different kinds of charts. I hope to add more methods for other chart types as I need them.

1
 2
 3
 4
 5
 6
 7
 8
 9
10
11
12
13
14
15
16
17
18
19
20
21
22
23
24
25
26
27
28
29
30
31
32
33
34
35
36
37
38
39
40
41
42
43
44
45
46
47
48
// Source: src/main/scala/com/mycompany/claimintel/ChartService.scala
package com.mycompany.claimintel

import java.awt.Color
import java.io.OutputStream

import org.jfree.chart.ChartFactory
import org.jfree.chart.ChartRenderingInfo
import org.jfree.chart.ChartUtilities
import org.jfree.chart.axis.AxisLocation
import org.jfree.chart.entity.StandardEntityCollection
import org.jfree.chart.plot.CategoryPlot
import org.jfree.chart.plot.PlotOrientation
import org.jfree.data.category.DefaultCategoryDataset
import org.springframework.stereotype.Service
import org.apache.commons.lang3.StringUtils

@Service
class ChartService {

  def name = "ChartService"
    
  def bar(data: Map[String,Double], title: String,
      xtitle: String, ytitle: String,
      horizontal: Boolean, width: Int, height: Int,
      ostream: OutputStream): Unit = {
    val dataset = new DefaultCategoryDataset()
    // if data is a range, then sort them differently
    val sortedKeys = if (data.keys.head.indexOf("-") > -1)
      data.keys.toList.sortWith((a,b) => 
        a.split("-")(0).toInt < b.split("-")(0).toInt)
      else data.keys.toList.sorted
    sortedKeys.map(k => dataset.addValue(data(k), title, k))
    val orientation = if (horizontal) PlotOrientation.HORIZONTAL 
                      else PlotOrientation.VERTICAL
    val chart = ChartFactory.createBarChart(title, xtitle, ytitle, 
      dataset, orientation, false, true, false)
    val plot = chart.getPlot().asInstanceOf[CategoryPlot]
    plot.setBackgroundPaint(Color.WHITE)
    plot.setRangeGridlinePaint(Color.WHITE)
    plot.setRangeAxisLocation(AxisLocation.BOTTOM_OR_LEFT)
    plot.setNoDataMessage(if (title.isEmpty) "Please Wait" else title) 
    val info = new ChartRenderingInfo(new StandardEntityCollection())
    val image = chart.createBufferedImage(width, height, info)
    ChartUtilities.writeBufferedImageAsPNG(ostream, image)
    ostream.flush()
  }
}

Data Transfer Objects


As I mentioned earlier, one problem with using JSTL is that it expects Java POJOs and Collections. While Scala provides a JavaConversions class that provides such conversions, it becomes tiresome to do this for each thing you want to stick into the Model. Also, while Scala case classes are really convenient, I couldn't get JSTL to recognize methods in them. So my solution was to build a mixed-language project (SBT can build pure Scala, pure Java, or mixed Scala+Java projects without any changes), where I built two POJOs for transferring data from the Scala controller to the JSTL JSPs. The controller populates these POJOs, using JavaConversions as needed (minimal compared to the first approach). Here are my POJOs, nothing fancy, just a class with a bunch of getters and setters.

1
 2
 3
 4
 5
 6
 7
 8
 9
10
11
12
13
14
15
16
17
18
19
20
21
22
23
24
25
26
27
28
29
30
31
32
33
34
35
36
37
38
39
40
41
42
43
44
45
46
47
48
49
50
51
52
53
54
55
56
57
58
59
60
61
62
63
64
65
66
67
68
69
70
71
72
73
74
75
76
77
78
// Source: src/main/java/com/mycompany/claimintel/dtos/PopDistrib.java
package com.mycompany.claimintel.dtos;

import java.util.List;

public class PopDistrib {
  
  private String encodedData;
  private List<CategoryStats> stats;
  private long total;
  
  public String getEncodedData() {
    return encodedData;
  }
  
  public void setEncodedData(String encodedData) {
    this.encodedData = encodedData;
  }
  
  public List<CategoryStats> getStats() {
    return stats;
  }
  
  public void setStats(List<CategoryStats> stats) {
    this.stats = stats;
  }

  public long getTotal() {
    return total;
  }

  public void setTotal(long total) {
    this.total = total;
  }
}

// Source: src/main/java/com/mycompany/claimintel/dtos/CategoryStats.java
package com.mycompany.claimintel.dtos;

public class CategoryStats {

  private String name;
  private long count;
  private double pcount;
  private boolean selected;
  
  public String getName() {
    return name;
  }

  public void setName(String name) {
    this.name = name;
  }

  public long getCount() {
    return count;
  }
  
  public void setCount(long count) {
    this.count = count;
  }
  
  public double getPcount() {
    return pcount;
  }
  
  public void setPcount(double pcount) {
    this.pcount = pcount;
  }

  public boolean isSelected() {
    return selected;
  }

  public void setSelected(boolean selected) {
    this.selected = selected;
  }
}

View


Finally, the view is a plain old JSTL JSP. My JSP skills are not that great, you will probably notice a great deal of redundancy. Each block deals with displaying the data for an individual dimension, and the whole thing is wrapped in a form. Here is the JSP.

1
  2
  3
  4
  5
  6
  7
  8
  9
 10
 11
 12
 13
 14
 15
 16
 17
 18
 19
 20
 21
 22
 23
 24
 25
 26
 27
 28
 29
 30
 31
 32
 33
 34
 35
 36
 37
 38
 39
 40
 41
 42
 43
 44
 45
 46
 47
 48
 49
 50
 51
 52
 53
 54
 55
 56
 57
 58
 59
 60
 61
 62
 63
 64
 65
 66
 67
 68
 69
 70
 71
 72
 73
 74
 75
 76
 77
 78
 79
 80
 81
 82
 83
 84
 85
 86
 87
 88
 89
 90
 91
 92
 93
 94
 95
 96
 97
 98
 99
100
101
102
103
104
105
106
107
108
109
110
111
112
113
114
115
116
117
118
119
120
121
122
123
124
125
126
127
128
129
130
131
132
133
134
135
136
137
138
139
140
141
142
143
144
145
146
147
148
149
150
151
152
153
154
155
156
157
158
159
160
161
162
163
164
165
166
167
168
169
170
171
172
173
174
175
176
177
178
179
180
181
182
183
184
185
186
187
188
189
190
191
192
193
194
195
196
197
198
199
<!-- Source: src/main/webapp/WEB-INF/views/index.jsp -->
<%@ page language="java" contentType="text/html; charset=UTF-8" pageEncoding="UTF-8"%>
<%@ taglib prefix="c" uri="http://java.sun.com/jsp/jstl/core"%>
<%@ taglib prefix="fn" uri="http://java.sun.com/jsp/jstl/functions"%>
<%@ taglib prefix="fmt" uri="http://java.sun.com/jsp/jstl/fmt" %>
<html>
  <head>
    <title>ClaimIntel :: Population Statistics</title>
  </head>
  <body>
    <h2>Distribution of Member Population across different dimensions</h2>
    <hr/>

    <form method="GET" action="/population.html">
      <input type="hidden" name="filter" value="true"/>

      <p>
      <h3>Distribution by Gender</h3>
      <table cellspacing="3" cellpadding="0" border="0" width="100%">
        <tr>
          <td width="50%" valign="top">
            <img src="/chart.html?type=bar&data=${bene_sex.encodedData}&height=200"/>
          </td>
          <td width="50%" valign="top">
            <table cellspacing="1" cellpadding="0" border="1">
              <tr>
                <td><b>Gender</b></td>
                <td><b>Frequency</b></td>
                <td><b>Relative Frequency (%)</b></td>
                <td><b>Filter</b></td>
              </tr>
              <c:forEach items="${bene_sex.stats}" var="stat">
              <tr>
                <td>${stat.name}</td>
                <td><fmt:formatNumber type="number" maxFractionDigits="0" value="${stat.count}"/></td>
                <td><fmt:formatNumber type="percent" maxFractionDigits="2" value="${stat.pcount}"/></td>
                <td><input type="checkbox" name="bene_sex" value="${stat.name}" <c:if test="${stat.selected}">checked</c:if> /></td>
              </tr>
              </c:forEach>
              <tr>
                <td><b>Total</b></td>
                <td><b><fmt:formatNumber type="number" maxFractionDigits="0" value="${bene_sex.total}"/></b></td>
                <td><b>100.00%</b></td>
                <td/>
              </tr>
            </table><br/><br/>
          </td>
        </tr>
      </table>
      </p>

      <p>
      <h3>Distribution by Age</h3>
      <table cellspacing="3" cellpadding="0" border="0" width="100%">
        <tr>
          <td width="50%" valign="top">
            <img src="/chart.html?type=bar&data=${bene_age.encodedData}"/>
          </td>
          <td width="50%" valign="top">
            <table cellspacing="1" cellpadding="0" border="1">
              <tr>
                <td><b>Age</b></td>
                <td><b>Frequency</b></td>
                <td><b>Relative Frequency (%)</b></td>
                <td><b>Filter</b></td>
              </tr>
              <c:forEach items="${bene_age.stats}" var="stat">
              <tr>
                <td>${stat.name}</td>
                <td><fmt:formatNumber type="number" maxFractionDigits="0" value="${stat.count}"/></td>
                <td><fmt:formatNumber type="percent" maxFractionDigits="2" value="${stat.pcount}"/></td>
                <td><input type="checkbox" name="bene_age" value="${stat.name}" <c:if test="${stat.selected}">checked</c:if> /></td>
              </tr>
              </c:forEach>
              <tr>
                <td><b>Total</b></td>
                <td><b><fmt:formatNumber type="number" maxFractionDigits="0" value="${bene_sex.total}"/></b></td>
                <td><b>100.00%</b></td>
                <td/>
              </tr>
            </table><br/><br/>
          </td>
        </tr>
      </table>
      </p>

      <p>
      <h3>Distribution by Ethnicity</h3>
      <table cellspacing="3" cellpadding="0" border="0" width="100%">
        <tr>
          <td width="50%" valign="top">
            <img src="/chart.html?type=bar&data=${bene_race.encodedData}"/>
          </td>
          <td width="50%" valign="top">
            <table cellspacing="1" cellpadding="0" border="1">
              <tr>
                <td><b>Ethnicity</b></td>
                <td><b>Frequency</b></td>
                <td><b>Relative Frequency (%)</b></td>
                <td><b>Filter</b></td>
              </tr>
              <c:forEach items="${bene_race.stats}" var="stat">
              <tr>
                <td>${stat.name}</td>
                <td><fmt:formatNumber type="number" maxFractionDigits="0" value="${stat.count}"/></td>
                <td><fmt:formatNumber type="percent" maxFractionDigits="2" value="${stat.pcount}"/></td>
                <td><input type="checkbox" name="bene_race" value="${stat.name}" <c:if test="${stat.selected}">checked</c:if> /></td>
              </tr>
              </c:forEach>
              <tr>
                <td><b>Total</b></td>
                <td><b><fmt:formatNumber type="number" maxFractionDigits="0" value="${bene_race.total}"/></b></td>
                <td><b>100.00%</b></td>
                <td/>
              </tr>
            </table><br/><br/>
          </td>
        </tr>
      </table>
      </p>

      <p>
      <h3>Distribution by State</h3>
      <table cellspacing="3" cellpadding="0" border="0" width="100%">
        <tr>
          <td width="50%" valign="top">
            <img src="/chart.html?type=bar&data=${sp_state.encodedData}&height=1200"/>
          </td>
          <td width="50%" valign="top">
            <table cellspacing="1" cellpadding="0" border="1">
              <tr>
                <td><b>State</b></td>
                <td><b>Frequency</b></td>
                <td><b>Relative Frequency (%)</b></td>
                <td><b>Filter</b></td>
              </tr>
              <c:forEach items="${sp_state.stats}" var="stat">
              <tr>
                <td>${stat.name}</td>
                <td><fmt:formatNumber type="number" maxFractionDigits="0" value="${stat.count}"/></td>
                <td><fmt:formatNumber type="percent" maxFractionDigits="2" value="${stat.pcount}"/></td>
                <td><input type="checkbox" name="sp_state" value="${stat.name}" <c:if test="${stat.selected}">checked</c:if> /></td>
              </tr>
              </c:forEach>
              <tr>
                <td><b>Total</b></td>
                <td><b><fmt:formatNumber type="number" maxFractionDigits="0" value="${sp_state.total}"/></b></td>
                <td><b>100.00%</b></td>
                <td/>
              </tr>
            </table><br/><br/>
          </td>
        </tr>
      </table>
      </p>

      <p>
      <h3>Distribution by Disease</h3>
      <table cellspacing="3" cellpadding="0" border="0" width="100%">
        <tr>
          <td width="50%" valign="top">
            <img src="/chart.html?type=bar&data=${bene_comorbs.encodedData}"/>
          </td>
          <td width="50%" valign="top">
            <table cellspacing="1" cellpadding="0" border="1">
              <tr>
                <td><b>Disease</b></td>
                <td><b>Frequency</b></td>
                <td><b>Relative Frequency (%)</b></td>
                <td><b>Filter</b></td>
              </tr>
              <c:forEach items="${bene_comorbs.stats}" var="stat">
              <tr>
                <td>${stat.name}</td>
                <td><fmt:formatNumber type="number" maxFractionDigits="0" value="${stat.count}"/></td>
                <td><fmt:formatNumber type="percent" maxFractionDigits="2" value="${stat.pcount}"/></td>
                <td><input type="checkbox" name="bene_comorbs" value="${stat.name}" <c:if test="${stat.selected}">checked</c:if> /></td>
              </tr>
              </c:forEach>
              <tr>
                <td><b>Total</b></td>
                <td><b><fmt:formatNumber type="number" maxFractionDigits="0" value="${bene_comorbs.total}"/></b></td>
                <td><b>${bene_comorbs.total}</b></td>
                <td><b>100.00%</b></td>
                <td/>
              </tr>
            </table><br/><br/>
          </td>
        </tr>
      </table>
      </p>

      <input type="submit" value="Filter Results"/>&nbsp;||&nbsp;
      <a href="/population.html">Clear Filters</a>

    </form>

  </body>
</html>

And finally, this is what the landing page looks like. Its quite long so I show the top (showing the gender, age and ethnicity dimensions) and the bottom (showing the state of residence (partial) and disease comorbidity dimensions).


Some preliminary observations from the charts above... The Male-Female distribution seems to be almost evenly distributed, the maximum number of members seem to be between 60 and 90 years old, membership seems to be predominantly white, the top four states where members are located are CA, FL, TX and NY, Ischemic Heart Disease (IHD) seems to be the most predominant disease, followed by Diabetes. More insights can be had if you start filtering by various dimensions.

All the code I referred to in the post is available on this GitHub project. The GitHub version is going to be the authoritative version, and is likely to differ from the snapshots provided on this post as the project evolves.